
Verwandte Artikel zu Application of Visual Data in K-16 Science Classrooms...
Inhaltsangabe
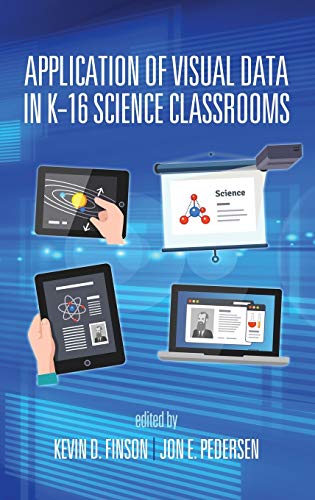
This book examines visual data use with students (PK-16) as well as in pre-service in- service science teacher preparation. Each chapter includes discussion about the current state of the art with respect to science classroom application and utilization of the particular visual data targeted by the author(s), discussion and explanation about the targeted visual data as applied by the author in his/her classroom, use of visual data as a diagnostic tool, its use as an assessment tool, and discussion of implications for science teaching and/or science teacher preparation. Although the body of research and practice in this field is growing, there remains a gap in the literature about clearly explicating the use of visual data in the science classroom. A growing body of literature discusses what visual data are (although this topic is still viewed as being at the beginning of its development in educators' thinking), and there are some scattered examples of studies exploring the use of visual data in science classrooms, although those studies have not necessarily clearly identified their foci as visual data, per se. As interest and attention has become more focused on visual data, a logical progression of questioning has been how visual data are actually applied in the science classroom, whether it be early elementary, college, or somewhere in between. Visual data applications of interest to the science education community include how it is identified, how it can be used with students and how students can generate it themselves, how it can be employed as a diagnostic tool in concept development, and how it can be utilized as an assessment tool. This book explores that, as well as a variety of pragmatic ways to help science educators more effectively utilize visual data and representations in their instruction.
Die Inhaltsangabe kann sich auf eine andere Ausgabe dieses Titels beziehen.
Über die Autorin bzw. den Autor
Kevin D. Finson, Bradley University, USA
Jon Pedersen, University of Nebraska-Lincoln, USA
„Über diesen Titel“ kann sich auf eine andere Ausgabe dieses Titels beziehen.
Suchergebnisse für Application of Visual Data in K-16 Science Classrooms...

Beispielbild für diese ISBN
Application of Visual Data in K-16 Science Classrooms (eng)
Anbieter: Brook Bookstore On Demand, Napoli, NA, Italien
Verkäuferbewertung 5 von 5 Sternen

Zustand: new. Artikel-Nr. 3074b5d3064f4da0b6baa8c803644fb6
Neu kaufen
EUR 113,72
EUR 8,00 Versand
Versand von Italien nach USA
Versand von Italien nach USA
Anzahl: Mehr als 20 verfügbar
Beispielbild für diese ISBN
Application of Visual Data in K-16 Science Classrooms
Anbieter: PBShop.store UK, Fairford, GLOS, Vereinigtes Königreich
Verkäuferbewertung 5 von 5 Sternen
HRD. Zustand: New. New Book. Shipped from UK. Established seller since 2000. Artikel-Nr. FW-9781681230481
Neu kaufen
EUR 114,76
EUR 7,05 Versand
Versand von Vereinigtes Königreich nach USA
Versand von Vereinigtes Königreich nach USA
Anzahl: 15 verfügbar
Beispielbild für diese ISBN
Application of Visual Data in K-16 Science Classrooms
Anbieter: Kennys Bookshop and Art Galleries Ltd., Galway, GY, Irland
Verkäuferbewertung 5 von 5 Sternen
Zustand: New. 2015. Illustrated. hardcover. . . . . . Artikel-Nr. V9781681230481
Neu kaufen
EUR 120,50
EUR 9,50 Versand
Versand von Irland nach USA
Versand von Irland nach USA
Anzahl: Mehr als 20 verfügbar
Foto des Verkäufers
Application of Visual Data in K-16 Science Classrooms
Anbieter: GreatBookPricesUK, Woodford Green, Vereinigtes Königreich
Verkäuferbewertung 5 von 5 Sternen
Zustand: New. Artikel-Nr. 23669400-n
Neu kaufen
EUR 114,75
EUR 18,02 Versand
Versand von Vereinigtes Königreich nach USA
Versand von Vereinigtes Königreich nach USA
Anzahl: Mehr als 20 verfügbar
Beispielbild für diese ISBN
Application of Visual Data in K-16 Science Classrooms
Anbieter: Majestic Books, Hounslow, Vereinigtes Königreich
Verkäuferbewertung 4 von 5 Sternen

Zustand: New. pp. 394. Artikel-Nr. 373587565
Neu kaufen
EUR 126,36
EUR 7,81 Versand
Versand von Vereinigtes Königreich nach USA
Versand von Vereinigtes Königreich nach USA
Anzahl: 3 verfügbar
Foto des Verkäufers
Application of Visual Data in K-16 Science Classrooms
Verlag:
Information Age Publishing, 2015
ISBN 10: 1681230488
ISBN 13: 9781681230481
Gebraucht
Hardcover
Anbieter: GreatBookPricesUK, Woodford Green, Vereinigtes Königreich
Verkäuferbewertung 5 von 5 Sternen
Zustand: As New. Unread book in perfect condition. Artikel-Nr. 23669400
Gebraucht kaufen
EUR 126,97
EUR 18,02 Versand
Versand von Vereinigtes Königreich nach USA
Versand von Vereinigtes Königreich nach USA
Anzahl: Mehr als 20 verfügbar
Beispielbild für diese ISBN
Application of Visual Data in K-16 Science Classrooms
Anbieter: Ria Christie Collections, Uxbridge, Vereinigtes Königreich
Verkäuferbewertung 5 von 5 Sternen
Zustand: New. In English. Artikel-Nr. ria9781681230481_new
Neu kaufen
EUR 139,89
EUR 15,41 Versand
Versand von Vereinigtes Königreich nach USA
Versand von Vereinigtes Königreich nach USA
Anzahl: Mehr als 20 verfügbar
Beispielbild für diese ISBN
Application of Visual Data in K-16 Science Classrooms
Anbieter: Kennys Bookstore, Olney, MD, USA
Verkäuferbewertung 4 von 5 Sternen
Zustand: New. 2015. Illustrated. hardcover. . . . . . Books ship from the US and Ireland. Artikel-Nr. V9781681230481
Neu kaufen
EUR 163,22
EUR 9,55 Versand
Versand innerhalb von USA
Versand innerhalb von USA
Anzahl: Mehr als 20 verfügbar
Foto des Verkäufers
Application of Visual Data in K-16 Science Classrooms (HC)
Anbieter: Home-set, Mannheim, Deutschland
Verkäuferbewertung 5 von 5 Sternen
Gebundene Ausgabe. Zustand: Neu. This book examines visual data use with students (PK-16) as well as in pre-service in- service scienceteacher preparation. Each chapter includes discussion about the current state of the art with respect toscience classroom application and utilization of the particular visual data targeted by the author(s),discussion and explanation about the targeted visual data as applied by the author in his/her classroom, useof visual data as a diagnostic tool, its use as an assessment tool, and discussion of implications for scienceteaching and/or science teacher preparation.Although the body of research and practice in this field is growing, there remains a gap in the literatureabout clearly explicating the use of visual data in the science classroom. A growing body of literaturediscusses what visual data are (although this topic is still viewed as being at the beginning of itsdevelopment in educators' thinking), and there are some scattered examples of studies exploring the use ofvisual data in science classrooms, although those studies have not necessarily clearly identified their foci asvisual data, per se. As interest and attention has become more focused on visual data, a logical progressionof questioning has been how visual data are actually applied in the science classroom, whether it be early elementary, college, or somewhere inbetween. Visual data applications of interest to the science education community include how it is identified, how it can be used with students and howstudents can generate it themselves, how it can be employed as a diagnostic tool in concept development, and how it can be utilized as an assessmenttool. This book explores that, as well as a variety of pragmatic ways to help science educators more effectively utilize visual data and representationsin their instruction. Sprache: Englisch Gewicht in Gramm: 710. Artikel-Nr. IB-8540000
Neu kaufen
EUR 160,75
EUR 49,90 Versand
Versand von Deutschland nach USA
Versand von Deutschland nach USA
Anzahl: 2 verfügbar