Inhaltsangabe
<>It is easy to create a bad looking chart in Excel. This book teaches you how to unlock the beautiful formatting options available to make incredible looking charts. The first section will talk about how to decide which chart type to use. Subsequent chapters will walk through each chart type, how to create them, how to utilize them, and special options available for each chart. The book discusses themes, colors, creating metallic charts, shadows, transparency, etc. The book also handles anything graphical in Excel. It will show the new In-Cell Data Bar charts available in Excel 2007. A section will talk about creating business flowcharts with IGX Graphics and how to display product pictures in Excel, and a section on VBA will cover creating 100's of charts using the macro language.
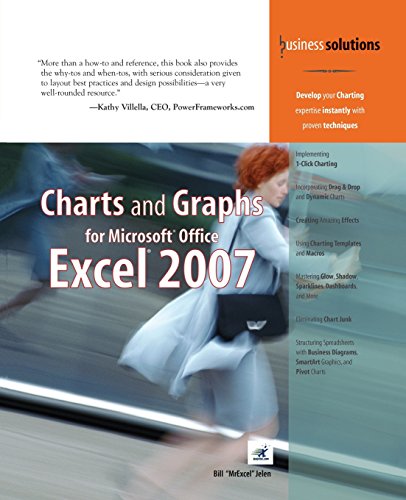
“More than a how-to and reference, this book also provides the why-tos and when-tos, with serious consideration given to layout best practices and design possibilities–a very well-rounded resource.”
–Kathy Villella, CEO, PowerFrameworks.com
- Implementing 1-Click Charting
- Incorporating Drag & Drop and Dynamic Charts
- Creating Amazing Effects
- Using Charting Templates and Macros
- Mastering Glow, Shadow, Sparklines, Dashboards, and More
- Eliminating Chart Junk
- Structuring Spreadsheets with Business Diagrams, SmartArt Graphics, and Pivot Charts
- Develop your Charting expertise instantly with proven techniques
After 15 years with no updates to the Excel charting engine, Microsoft has provided a complete rewrite of the chart rendering engine in Excel 2007. However, no amount of soft glow or glass bevel effects will help you communicate your point if you use the wrong chart type. This book helps you choose the right charting type and shows you how to make it look great.
This book shows you how to coax Excel to create many charts you might not have believed were possible. You’ll learn techniques that allow you to ditch the Microsoft defaults and actually create charts that communicate your point. You’ll learn why the Excel stock charts are so restrictive and how you can easily turn any line chart into a stock chart–without any limitations. You’ll also learn how to add invisible series to make columns float in midair. Learn how to create charts right in Excel cells using the new Excel 2007 data bars–or even the decades-old REPT function!
In no time, this book will have you creating charts that wow your audience and effectively communicate your message.
- Master effective visual display of data
- Choose the right chart type to convey your message
- Learn time-saving workarounds
- Create charts that most people think you can’t create with Excel
- Understand what a Radar chart is and when you might use it
- Summarize a million rows of data in a single pivot table chart
- Present data graphically without charts
- Employ SmartArt graphics to show process or relationship charts
- Utilize VBA to create charts
- Put your data on a map
- Export your charts to the web or PowerPoint
- Detect chart lies
ABOUT THE AUTHOR
Bill Jelen is MrExcel! He is principal behind the leading Excel website, MrExcel.com. He honed his Excel wizardry during his 12-year tenure as a financial analyst for a fastgrowing public computer firm. Armed with only a spreadsheet, he learned how to turn thousands of rows of transactional data into meaningful summaries in record time. He is an accomplished author of books on Excel and is a regular guest on The Lab on TechTV Canada. You can find Bill at your local accounting group chapter meeting entertaining audiences with his humorous and informative Power Excel seminar. His website hosts more than 12 million page views annually.
Introduction
1 Introducing Charts in Excel 2007
2 Customizing Charts
3 Creating Charts That Show Trends
4 Creating Charts That Show Differences
5 Creating Charts That Show Relationships
6 Creating Stock Analysis Charts
7 Advanced Chart Techniques
8 Creating and Using Pivot Charts
9 Presenting Data Visually Without Charts
10 Presenting Your Excel Data on a Map Using Microsoft MapPoint
11 Using SmartArt Graphics and Shapes
12 Exporting Your Charts for Use Outside of Excel
13 Using Excel VBA to Create Charts
14 Knowing When Someone Is Lying to You with a Chart
Appendix A: Charting References
Index
Die Inhaltsangabe kann sich auf eine andere Ausgabe dieses Titels beziehen.
�ber die Autorin bzw. den Autor
Bill Jelen is MrExcel! He is principal behind the leading Excel website, MrExcel.com. He honed his Excel wizardry during his 12-year tenure as a financial analyst for a fastgrowing public computer firm. Armed with only a spreadsheet, he learned how to turn thousands of rows of transactional data into meaningful summaries in record time. He is an accomplished author of books on Excel and is a regular guest on The Lab on TechTV Canada. You can find Bill at your local accounting group chapter meeting entertaining audiences with his humorous and informative Power Excel seminar. His website hosts more than 12 million page views annually.
Von der hinteren Coverseite
<>It is easy to create a bad looking chart in Excel. This book teaches you how to unlock the beautiful formatting options available to make incredible looking charts. The first section will talk about how to decide which chart type to use. Subsequent chapters will walk through each chart type, how to create them, how to utilize them, and special options available for each chart. The book discusses themes, colors, creating metallic charts, shadows, transparency, etc. The book also handles anything graphical in Excel. It will show the new In-Cell Data Bar charts available in Excel 2007. A section will talk about creating business flowcharts with IGX Graphics and how to display product pictures in Excel, and a section on VBA will cover creating 100's of charts using the macro language.
“More than a how-to and reference, this book also provides the why-tos and when-tos, with serious consideration given to layout best practices and design possibilities–a very well-rounded resource.”
–Kathy Villella, CEO, PowerFrameworks.com
- Implementing 1-Click Charting
- Incorporating Drag & Drop and Dynamic Charts
- Creating Amazing Effects
- Using Charting Templates and Macros
- Mastering Glow, Shadow, Sparklines, Dashboards, and More
- Eliminating Chart Junk
- Structuring Spreadsheets with Business Diagrams, SmartArt Graphics, and Pivot Charts
- Develop your Charting expertise instantly with proven techniques
After 15 years with no updates to the Excel charting engine, Microsoft has provided a complete rewrite of the chart rendering engine in Excel 2007. However, no amount of soft glow or glass bevel effects will help you communicate your point if you use the wrong chart type. This book helps you choose the right charting type and shows you how to make it look great.
This book shows you how to coax Excel to create many charts you might not have believed were possible. You’ll learn techniques that allow you to ditch the Microsoft defaults and actually create charts that communicate your point. You’ll learn why the Excel stock charts are so restrictive and how you can easily turn any line chart into a stock chart–without any limitations. You’ll also learn how to add invisible series to make columns float in midair. Learn how to create charts right in Excel cells using the new Excel 2007 data bars–or even the decades-old REPT function!
In no time, this book will have you creating charts that wow your audience and effectively communicate your message.
- Master effective visual display of data
- Choose the right chart type to convey your message
- Learn time-saving workarounds
- Create charts that most people think you can’t create with Excel
- Understand what a Radar chart is and when you might use it
- Summarize a million rows of data in a single pivot table chart
- Present data graphically without charts
- Employ SmartArt graphics to show process or relationship charts
- Utilize VBA to create charts
- Put your data on a map
- Export your charts to the web or PowerPoint
- Detect chart lies
ABOUT THE AUTHOR
Bill Jelen is MrExcel! He is principal behind the leading Excel website, MrExcel.com. He honed his Excel wizardry during his 12-year tenure as a financial analyst for a fastgrowing public computer firm. Armed with only a spreadsheet, he learned how to turn thousands of rows of transactional data into meaningful summaries in record time. He is an accomplished author of books on Excel and is a regular guest on The Lab on TechTV Canada. You can find Bill at your local accounting group chapter meeting entertaining audiences with his humorous and informative Power Excel seminar. His website hosts more than 12 million page views annually.
Introduction
1 Introducing Charts in Excel 2007
2 Customizing Charts
3 Creating Charts That Show Trends
4 Creating Charts That Show Differences
5 Creating Charts That Show Relationships
6 Creating Stock Analysis Charts
7 Advanced Chart Techniques
8 Creating and Using Pivot Charts
9 Presenting Data Visually Without Charts
10 Presenting Your Excel Data on a Map Using Microsoft MapPoint
11 Using SmartArt Graphics and Shapes
12 Exporting Your Charts for Use Outside of Excel
13 Using Excel VBA to Create Charts
14 Knowing When Someone Is Lying to You with a Chart
Appendix A: Charting References
Index
��ber diesen Titel� kann sich auf eine andere Ausgabe dieses Titels beziehen.
Weitere beliebte Ausgaben desselben Titels

Suchergebnisse f�r Charts and Graphs for Microsoft Office Excel 2007

Beispielbild f�r diese ISBN
Charts and Graphs for Microsoft Office Excel 2007
Anbieter: Sell Books, Elland, YORKS, Vereinigtes K�nigreich
Verk�uferbewertung 5 von 5 Sternen
![]()
paperback. Zustand: Good. Our good condition books are generally good for reading but not for gifting or collecting. They could have imperfections such as creasing, fanning, inscriptions, margin notes, yellowing, staining on edge or cover or pages, bumps, scuffs, etc etc (sometimes multiple of these). It's a wide category that encompasses anything that isn't almost-new down to anything that is slightly better than poor. We would NOT recommend gifting Good books - these should be considered reading copies. Our books are dispatched from a Yorkshire former cotton mill. We list via barcode/ISBN so please note that the images are stock images and may not be the exact copy you receive, furthermore the details about edition and year might not be accurate as many publishers reuse the same ISBN for multiple editions and as we simply scan a barcode or enter an ISBN we do not check the validity of the edition data when listing. If you're looking for an exact edition please don't order (at least not without checking with us first, although we don't always have time to check). We aim to dispatch prompty, the service used will depend on order value and book size. We can ship to most countries, see our shipping policies. Payment is via Abe only. Artikel-Nr. P-BGC00412-RAG-20241104-VG
Gebraucht kaufen
EUR 13,19
EUR 14,01 Versand
Versand von Vereinigtes K�nigreich nach USA
Versand von Vereinigtes K�nigreich nach USA
Anzahl: 1 verf�gbar
Beispielbild f�r diese ISBN
Charts and Graphs for Microsoft Office Excel 2007 Jelen, Bill
Verlag:
Que Publishing, 2007
ISBN 10: 0789736101
ISBN 13: 9780789736109
Gebraucht
Paperback Apr 24, 2007
Anbieter: online-buch-de, Dozwil, Schweiz
Verk�uferbewertung 5 von 5 Sternen
![]()
Paperback Apr 24, 2007. Zustand: gebraucht; wie neu. Artikel-Nr. 506-2-1-9
Gebraucht kaufen
EUR 33,00
EUR 36,00 Versand
Versand von Schweiz nach USA
Versand von Schweiz nach USA
Anzahl: 1 verf�gbar
Beispielbild f�r diese ISBN
Charts and Graphs for Microsoft Office Excel 2007
Anbieter: Revaluation Books, Exeter, Vereinigtes K�nigreich
Verk�uferbewertung 5 von 5 Sternen
![]()
Paperback. Zustand: Brand New. 1st edition. 461 pages. 9.25x7.00x1.00 inches. In Stock. Artikel-Nr. zk0789736101
Neu kaufen
EUR 59,24
EUR 14,42 Versand
Versand von Vereinigtes K�nigreich nach USA
Versand von Vereinigtes K�nigreich nach USA
Anzahl: 1 verf�gbar